# NginX Proxy Manager Live Tracking

**URL:** https://discussion.scottibyte.com/t/nginx-proxy-manager-live-tracking/1547
**Category:** Uncategorized
**Created:** [September 27, 2026, 11:47pm UTC](https://discussion.scottibyte.com/t/nginx-proxy-manager-live-tracking/1547 "2026-09-27T23:47:55Z")
**Posts on this page:** 3
**Page:** 1

<div class="post-metadata">

### Author: ![scott](https://discussion.scottibyte.com/letter_avatar_proxy/v4/letter/s/3e96dc/32.png) [@scott](https://discussion.scottibyte.com/u/scott)
#### Post date: [September 27, 2026, 11:47pm UTC](https://discussion.scottibyte.com/t/nginx-proxy-manager-live-tracking/1547/1 "2026-09-27T23:47:55Z")

</div>

I use NginX Proxy Manager to provide reverse proxy lookups for my self hosted public services which I have described many times on the channel. I have always wanted a way to know where the people are located that are connecting to my public services.

[GeoMetrikks](https://github.com/GilbN/geometrikks) is a real-time nginx/traefik/caddy access log ingestion and geo-location tracking service built with Litestar. It parses access logs, performs GeoIP lookups, and stores geo-events and access logs in PostgreSQL with TimeScaleDB/PostGIS extensions.

 ![image](https://discussion.scottibyte.com/uploads/default/original/2X/a/a604d52acdcd6a6728ccfe4ab2a04c8e18511388.jpeg)

I have always been extremely hesitant to make any changes in my NginX Proxy Manager (NPM) configuration. That’s because I rely on NPM to host all of my services I have found that it can be fragile.

In this tutorial I am assuming that your NPM is configured as a docker container nested in an incus container.

So, we want to create a dedicated incus container for Geometrikks which will be on the same Incus server as NPM:

```auto
incus launch images:ubuntu/26.04 NPM-Analytics -p default -p bridgeprofile -c security.nesting=true -c boot.autostart=true

```

Connect to the new container.

```auto
incus shell NPM-Analytics

```

Accept the updates:

```auto
apt update && apt upgrade -y

```

Install some dependencies:

```auto
apt install curl nano net-tools openssh-server -y

```

Install Docker from the script on the Docker website:

```auto
curl https://get.docker.com | sh

```

Add a user account (use your name).

```auto
adduser scott

```

Put your user in the sudo and docker groups:

```auto
usermod -aG sudo,docker scott

```

Log into the new account.

```auto
su - scott

```

Create the required folder structure.

```auto
mkdir -p geometrikks npmlogs

```

The npmlogs folder is a readonly mount point for the NPM log data which we will configure later. Now move inside of the application folder.

```auto
cd geometrikks

```

Create an environment variable file:

```auto
nano .env

```

Insert the following template into the editor.

```auto
# GeoMetrikks configuration - the short list. Full reference: docs/configuration.md

# Login for the web UI (required unless APP_AUTH_DISABLED=true)
APP_ADMIN_USER=USERNAME
APP_ADMIN_PASSWORD=PASSWORD

# Set true ONLY behind an authenticating reverse proxy (Authelia, Tailscale...)
APP_AUTH_DISABLED=false

# Mark the session cookie Secure (browsers then only send it over HTTPS).
# Recommended when serving behind a TLS reverse proxy.
APP_SESSION_SECURE=false
# Reverse-proxy IPs/CIDRs allowed to supply X-Forwarded-For (used for login
# logging). One value, comma-separated, or a JSON list. Empty = never trust
# forwarded headers.
APP_TRUSTED_PROXIES=

# MaxMind GeoLite2 auto-download (free account: maxmind.com/en/geolite2/signup)
MAXMINDDB_USER_ID=MAXMINDID
MAXMINDDB_LICENSE_KEY=MAXMINDLICENSE

# CARTO basemap API key (free: carto.com/basemaps/apikey). CARTO's terms
# require one per deployment. The key is sent to the browser, so treat it
# as public. Optional today; keyless tiles may stop working at any time.
MAP_CARTO_API_KEY="MAPKEYHERE-LEAVE-QUOTES"

# Access log(s) to tail (nginx, Traefik JSON or Caddy JSON) - a single path
# or JSON list. The compose file mounts $ACCESS_LOG_DIR (default
# /var/log/nginx) read-only at /var/log/access inside the container. See
# README for Traefik and Caddy setup.
LOGPARSER_LOG_PATHS=[]
ACCESS_LOG_DIR=/home/scott/npmlogs

# Format of the file(s) above: auto (default, detected per file),
# geometrikks-json, nginx, traefik-json, or caddy-json. Only needed if you
# want to pin a format instead of detecting.
#LOGPARSER_LOG_FORMATS=auto

# Hostname label attached to ingested events
LOGPARSER_HOST_NAME=NPM-Analytics

# Database password (used by both containers; change from the default)
DB_PASSWORD=geopass

# Uid/gid the app runs as; ./logs is chowned to this at startup. Match your
# host user (id -u / id -g) if host tools need to manage the log files.
PUID=1001
PGID=1001

# Optional: CrowdSec integration (read-only decision views + ban stats)
# docker exec crowdsec cscli bouncers add geometrikks -> prints the API key
#CROWDSEC_LAPI_URL=http://crowdsec:8080
#CROWDSEC_BOUNCER_API_KEY=jhsf77SJHhsg87
# Optional: also allow ban/unban from the UI
# docker exec crowdsec cscli machines add geometrikks --auto -> id + password
#CROWDSEC_MACHINE_ID=
#CROWDSEC_MACHINE_PASSWORD=
APP_PROXY_ADVISORY=false

```

In the template above, replace the USERNAME and PASSWORD with a username and password that you want to use to log into the web interface. At this point, log into [Maxmind](https://www.maxmind.com/en/account/sign-in) or create a free Maxmind account. Maxmind is required for the Geolocation information.

 ![image](https://discussion.scottibyte.com/uploads/default/original/2X/c/cb5deabf0481dd51ec37b431df1ef12aab7b8177.png)

On your free Maxmind account generate a new License key.

 ![image](https://discussion.scottibyte.com/uploads/default/original/2X/a/a139505ee64dbafce1a2dff9503001562988b9fd.png)

In the configuration template, set your Maxmind user ID and your Maxmind license key that you just created.

Now sign on to [Carto](https://carto.com/basemaps/apikey) and get a free Basemaps API key without the need for an account.

 ![image](https://discussion.scottibyte.com/uploads/default/original/2X/9/90408023183a813c0fd7cb294107b5498b03e112.png)

Put the key you got into the template as MAP\_CARTO\_API\_KEY.

The LOGPARSER\_LOG\_PATHS will be a big long list. In general, there are some basic names and then there is long proxy host name list for each proxy host. So if you have 10 reverse proxy hosts defined in NPM, expect to find 10 host log file names. You will be able to see those names from a script later on.

The ACCESS\_LOG\_DIR=/home/scott/npmlogs you will want to change from “scott” to your username.

You can save the .env file for now with a CTRL O and enter and a CTRL X to exit the nano editor. You can come back and edit the paths later.

Open another terminal to your actual Incus server (not the Geometrikks container we have open now).

If the name of your NPM container is EXACTLY “NPM”, then we want to allow the new NPM-Analytics server READ-ONLY access to the NPM log data. Be sure to change the “scott” in the two places in the command below to be your username.

```auto
incus config device add NPM-Analytics npmlogs disk \
  source=/var/lib/incus/containers/NPM/rootfs/home/scott/NPM/data/logs \
  path=/home/scott/npmlogs \
  readonly=true

```

This provides READONLY access to the log files in NPM from the NPM-Analytics container. Back in the NPM-Analytics container, move into the npmlogs folder and you should be able to see the NPM logs at this point.

 ![image](https://discussion.scottibyte.com/uploads/default/original/2X/1/1cc3ea2ccd4e4dc08a277e7f9a5e1d675d3344fc.png)

If the log files do not show, then restart the NPM-Analytics container.

![image](https://discussion.scottibyte.com/uploads/default/original/2X/c/cff0d3fc125b63c0eb5b592e66bb5c197c858091.png)

The next step is to create the docker compose file in the NPM-Analytics container.

```auto
cd ~/geometrikks
nano docker-compose.yml

```

Paste the following into the editor.

```auto
# GeoMetrikks — user-facing compose. Quickstart:
# mkdir geometrikks && cd geometrikks
# curl -LO https://raw.githubusercontent.com/GilbN/geometrikks/main/docker-compose.yml
# curl -Lo .env https://raw.githubusercontent.com/GilbN/geometrikks/main/.env.example
# $EDITOR .env # set APP_ADMIN_PASSWORD, MaxMind key, log path
# docker compose up -d
#
# ./logs on the host holds the application log and login.log, readable by
# host-side tools like CrowdSec/fail2ban. The container chowns it to
# PUID:PGID (default 1000:1000) at startup; set PUID/PGID in .env to match
# your host user if you want different ownership.
#
# Developing GeoMetrikks itself? Use docker-compose.dev.yml instead.
services:
  timescale_db:
    image: timescale/timescaledb-ha:pg18
    restart: unless-stopped
    shm_size: 256mb
    # GeoMetrikks registers ~32 TimescaleDB background jobs and its CAGG
    # refresh policies all fire on the same tick; the image's default pool
    # (timescaledb.max_background_workers=16) is too small for that burst
    # and logs "failed to launch job ... out of background workers".
    # max_worker_processes must hold the whole pool: background workers +
    # max_parallel_workers + 3 internal processes.
    command:
      - -c
      - timescaledb.max_background_workers=40
      - -c
      - max_parallel_workers=8
      - -c
      - max_worker_processes=51
    environment:
      POSTGRES_USER: geouser
      POSTGRES_PASSWORD: ${DB_PASSWORD:-geopass}
      POSTGRES_DB: geometrikks
    volumes:
      - timescale_data:/home/postgres/pgdata/data
    healthcheck:
      test: ["CMD-SHELL", "pg_isready -U geouser -d geometrikks"]
      interval: 5s
      timeout: 5s
      retries: 5

  app:
    image: ghcr.io/gilbn/geometrikks:latest
    restart: unless-stopped
    hostname: geometrikks
    environment:
      DB_HOST: timescale_db
      DB_PASSWORD: ${DB_PASSWORD:-geopass}
      PUID: ${PUID:-1000}
      PGID: ${PGID:-1000}
    ports:
      - "80:8000"
    env_file:
      - .env
    volumes:
      - geoip_data:/app/data/geoip
      - ${ACCESS_LOG_DIR}:/var/log/access:ro
      # Exposes the application log and login.log on the host for tools like
      # CrowdSec/fail2ban, and persists them across container recreation.
      - ./logs:/app/logs
      - ./npm-parser/nginx.py:/app/.venv/lib/python3.13/site-packages/geometrikks/services/logparser/formats/nginx.py:ro
    depends_on:
      timescale_db:
        condition: service_healthy
    # Granian is started with --workers-kill-timeout 15; the default 10s
    # stop timeout SIGKILLs the container mid-teardown and drops the
    # ingestion batch still in flight.
    stop_grace_period: 20s

volumes:
  timescale_data:
  geoip_data:

```

Do a CTRL O and enter to save the file and CTRL X to exit the editor.

Create two folders in the geometrikss folder.

```auto
mkdir logs npm-parser

```

Generate the access log list by running the following script in the NPM-Analytics container.

```auto
cd ~/geometrikks

python3 - <<'PY'
import json
import re
import shutil
from datetime import datetime
from pathlib import Path

logs = sorted(Path("/home/scott/npmlogs").glob("*_access.log"))
if not logs:
    raise SystemExit("No access logs found; nothing changed.")

env = Path(".env")
text = env.read_text()
backup = ".env.backup-" + datetime.now().strftime("%Y%m%d-%H%M%S")
shutil.copy2(env, backup)

value = json.dumps(["/var/log/access/" + p.name for p in logs])
replacement = "LOGPARSER_LOG_PATHS='" + value + "'"
pattern = r"(?m)^[\t]*(?:export[\t]+)?LOGPARSER_LOG_PATHS[\t]*=.*$"

if re.search(pattern, text):
    text = re.sub(pattern, lambda _: replacement, text)
else:
    text = text.rstrip("\n") + "\n" + replacement + "\n"

env.write_text(text)
print(f"Configured {len(logs)} access logs.")
print(f"Backup: {backup}")
PY

```

Change the scott at the beginning of my script to your username and then paste it to run it.

Move into the parser folder.

```auto
cd ~/geometrikks/npm-parser

```

Create a new file if it does not exist and if it does we will replace it. This is a compatibility adapter I used with **GeoMetrikks v0.18.0** to read NPM’s existing log format without changing NPM.

```auto
nano nginx.py

```

Paste the following into the editor.

```auto
"""Adapter for the project's custom nginx log_format (see README, Nginx setup)."""
from __future__ import annotations

from datetime import datetime, timezone
from typing import Any

from geometrikks.server.logging import get_logger
from geometrikks.services.logparser.constants import (
    ipv4_geo_pattern,
    ipv4_pattern,
    ipv6_geo_pattern,
    ipv6_pattern,
)
from .base import NormalizedLine, convert_dash_to_none, detect_probe, parse_seconds

logger = get_logger( __name__ )

class NginxFormat:
    """Parses the custom nginx log_format via the existing regexes."""

    name = "nginx"

    def parse(self, line: str, *, geo_only: bool = False) -> NormalizedLine | None:
        """Validate the line against the IPv4/IPv6 patterns and normalize it.

        Args:
            line: Raw log line.
            geo_only: Only require the IP address and the timestamp (send_logs=False mode).

        Returns:
            NormalizedLine on a match, None when the line does not match.
        """
        npm = _parse_npm(line)
        if npm is not None:
            return npm

        if geo_only:
            matched = ipv4_geo_pattern().match(line) or ipv6_geo_pattern().match(line)
        else:
            matched = ipv4_pattern().match(line) or ipv6_pattern().match(line)
        if not matched:
            return None
        d: dict[str, str | Any] = matched.groupdict()

        try:
            ts = datetime.strptime(d["dateandtime"], "%d/%b/%Y:%H:%M:%S %z")
        except Exception as e:
            logger.error("Failed to parse timestamp '%s': %s", d.get("dateandtime"), e)
            ts = datetime.now(timezone.utc)

        if geo_only:
            return NormalizedLine(
                ip_address=matched.group(1),
                timestamp=ts,
                remote_user=convert_dash_to_none(d.get("remote_user")),
            )

        request_time = parse_seconds(d.get("request_time"))
        upstream_raw = d.get("upstream_response_time")
        try:
            upstream = (
                float(upstream_raw)
                if upstream_raw and upstream_raw != "-"
                else None
            )
        except (ValueError, TypeError):
            upstream = None
        try:
            status_code = int(d.get("status_code") or 0)
        except (ValueError, TypeError):
            status_code = 0
        try:
            bytes_sent = int(d.get("bytes_sent") or 0)
        except (ValueError, TypeError):
            bytes_sent = 0

        return NormalizedLine(
            ip_address=matched.group(1),
            timestamp=ts,
            remote_user=convert_dash_to_none(d.get("remote_user")),
            method=convert_dash_to_none(d.get("method")),
            # Historical group names are crossed: 'referrer' captures the URI
            # inside "$request", 'url' captures $http_referer.
            path=convert_dash_to_none(d.get("referrer")),
            referrer=convert_dash_to_none(d.get("url")),
            http_version=convert_dash_to_none(d.get("http_version")),
            status_code=status_code,
            bytes_sent=bytes_sent,
            user_agent=convert_dash_to_none(d.get("user_agent")),
            request_time=request_time,
            upstream_response_time=upstream,
            host=convert_dash_to_none(d.get("host")),
            request_raw=d.get("request", ""),
        )

    def detect_malformed(self, norm: NormalizedLine) -> tuple[bool, str | None]:
        """Probe classification; see ``detect_probe``."""
        return detect_probe(norm.request_raw, norm.method, norm.status_code)

# NPM_COMPAT_V1
import re as _npm_re
from ipaddress import ip_address as _npm_ip

_NPM_LINE = _npm_re.compile(
    r'^\[(?P<timestamp>[^\]]+)\]\s+'
    r'(?:\S+\s+.+?\s+)?(?P<status>\d{3})\s+-\s+'
    r'(?P<method>\S+)\s+(?P<scheme>\S+)\s+(?P<host>\S+)\s+'
    r'"(?P<path>[^"\r\n]*)"\s+\[Client (?P<ip>[^\]]+)\]\s+'
    r'\[Length (?P<bytes>\d+)\]\s+\[Gzip [^\]]*\]\s+'
    r'(?:\[Sent-to [^\]]*\]\s+)?'
    r'"(?P<agent>[^"\r\n]*)"\s+"(?P<referrer>[^"\r\n]*)"\s*$'
)

def _parse_npm(line):
    match = _NPM_LINE.match(line)
    if not match:
        return None
    d = match.groupdict()
    try:
        ip = str(_npm_ip(d["ip"]))
        stamp = datetime.strptime(d["timestamp"], "%d/%b/%Y:%H:%M:%S %z")
    except ValueError:
        return None
    return NormalizedLine(
        ip_address=ip,
        timestamp=stamp,
        method=convert_dash_to_none(d["method"]),
        path=convert_dash_to_none(d["path"]),
        status_code=int(d["status"]),
        bytes_sent=int(d["bytes"]),
        host=convert_dash_to_none(d["host"]),
        user_agent=convert_dash_to_none(d["agent"]),
        referrer=convert_dash_to_none(d["referrer"]),
    )

```

Save the file with a CTRL O and Enter and then CTRL X to exit the editor.

Run the application to ingest the logs the first time.

```auto
cd ~/geometrikks
docker compose up -d

docker compose exec --user 1001:1001 app \
  sh -c 'ls -l /var/log/access/*_access.log | head'

docker compose logs --since=2m app \
  | grep -Ei 'ingestion|geoip|parse|failed|error'

```

Finally, log into your incus server where you now have both the NPM and NPM-Analytics containers hosted.

For this to work properly, the NPM container must always be up and running before NPM-Analytics will work. Execute the following commands on your incus server (not in the container) to set the correct priorities.

```auto
incus config set NPM boot.autostart=true
incus config set NPM boot.autostart.priority=100

incus config set NPM-Analytics boot.autostart=true
incus config set NPM-Analytics boot.autostart.priority=50

incus config set NPM-Analytics boot.stop.priority=100
incus config set NPM boot.stop.priority=50

```

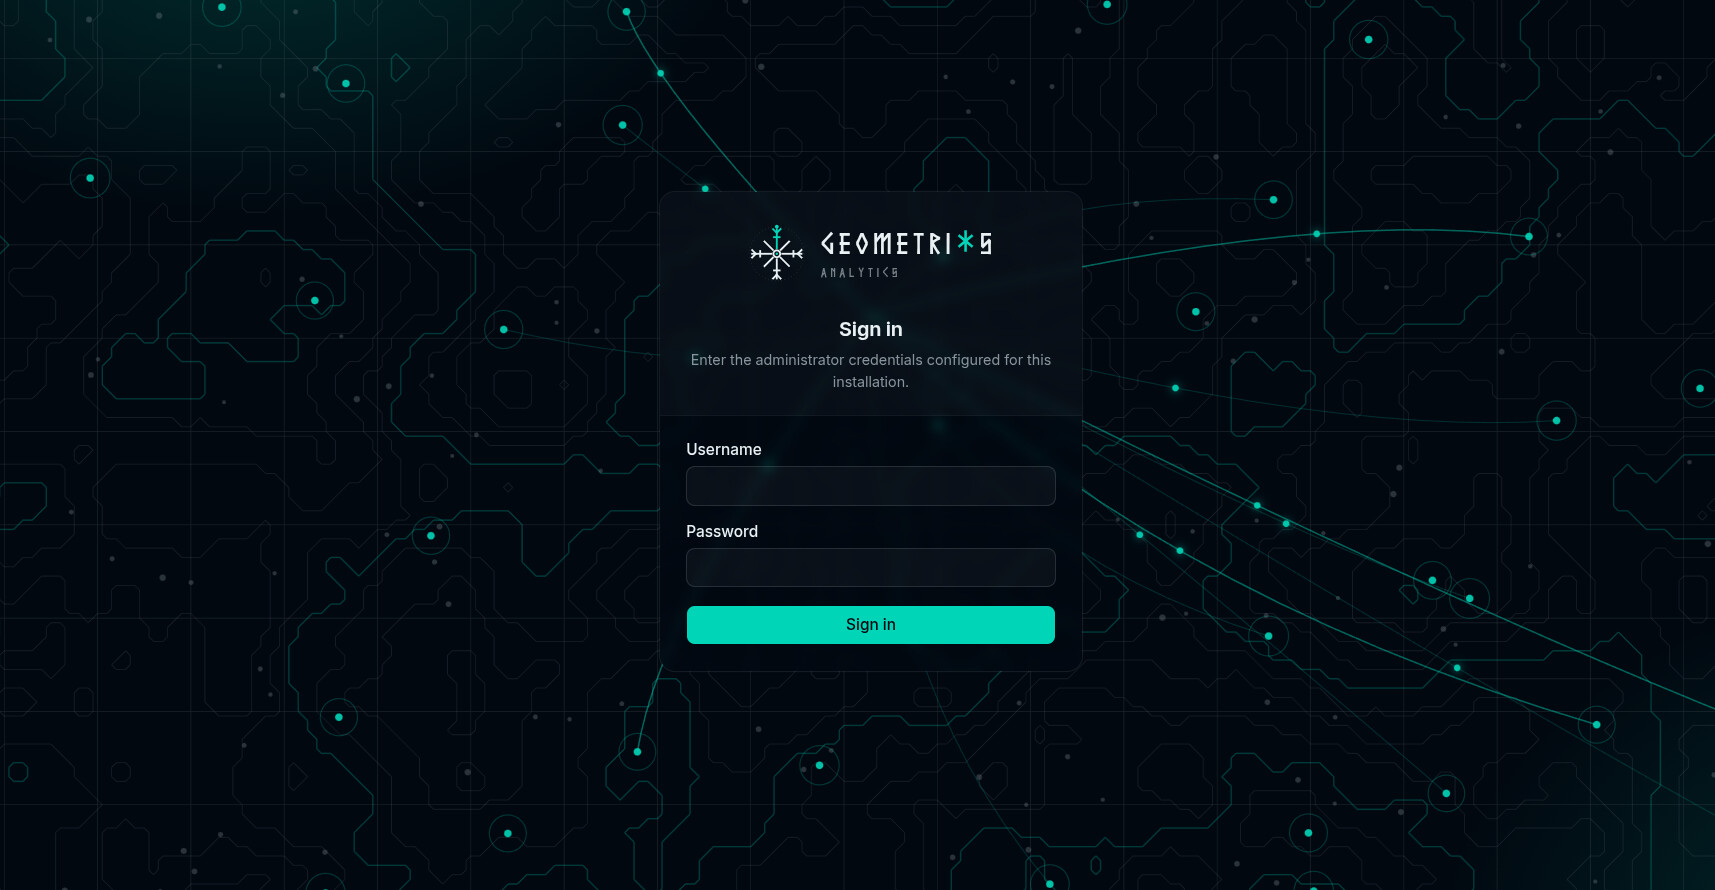
At this point, visit NPM-Analytics in your web browser using the address of your container.
 ![image](https://discussion.scottibyte.com/uploads/default/original/2X/6/633ddbe041bc9ad90dd2e5100b9abd467678afbf.jpeg)

Provide the username and the password you entered in your .env file and you should be logged in.
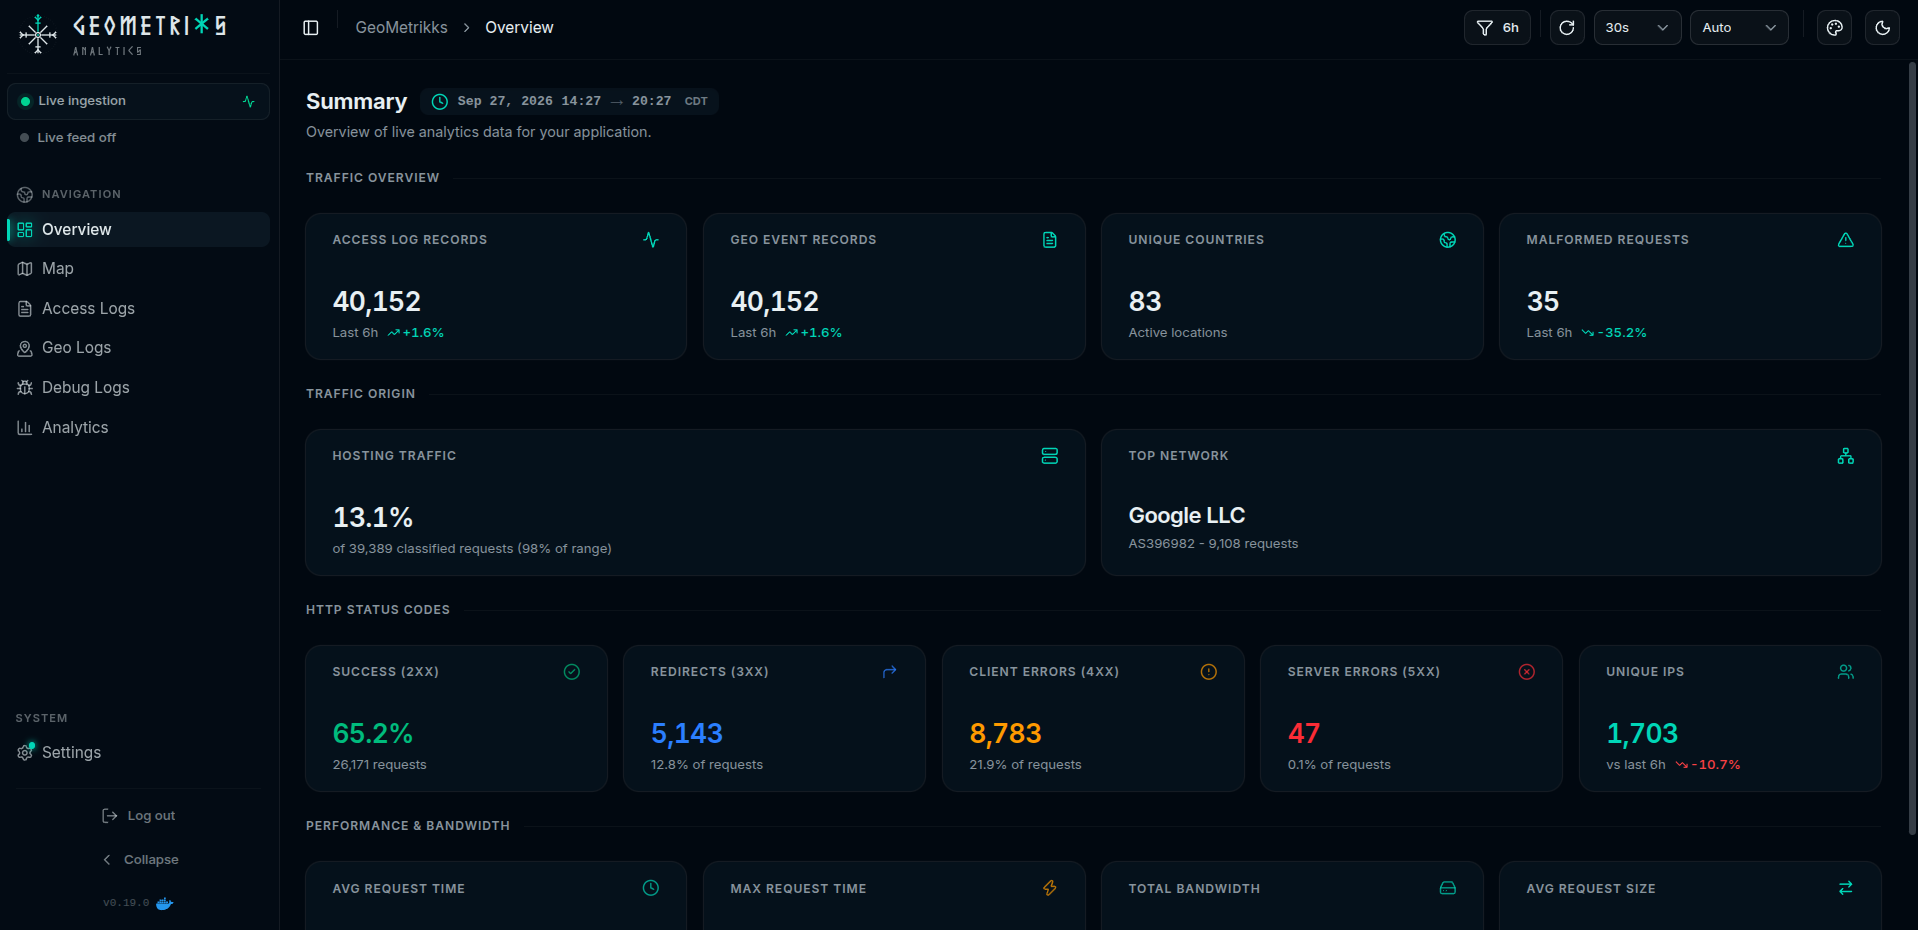
 ![image](https://discussion.scottibyte.com/uploads/default/original/2X/d/db09fafbb4b630da0fd32cfc9ee02fa26b451194.png)

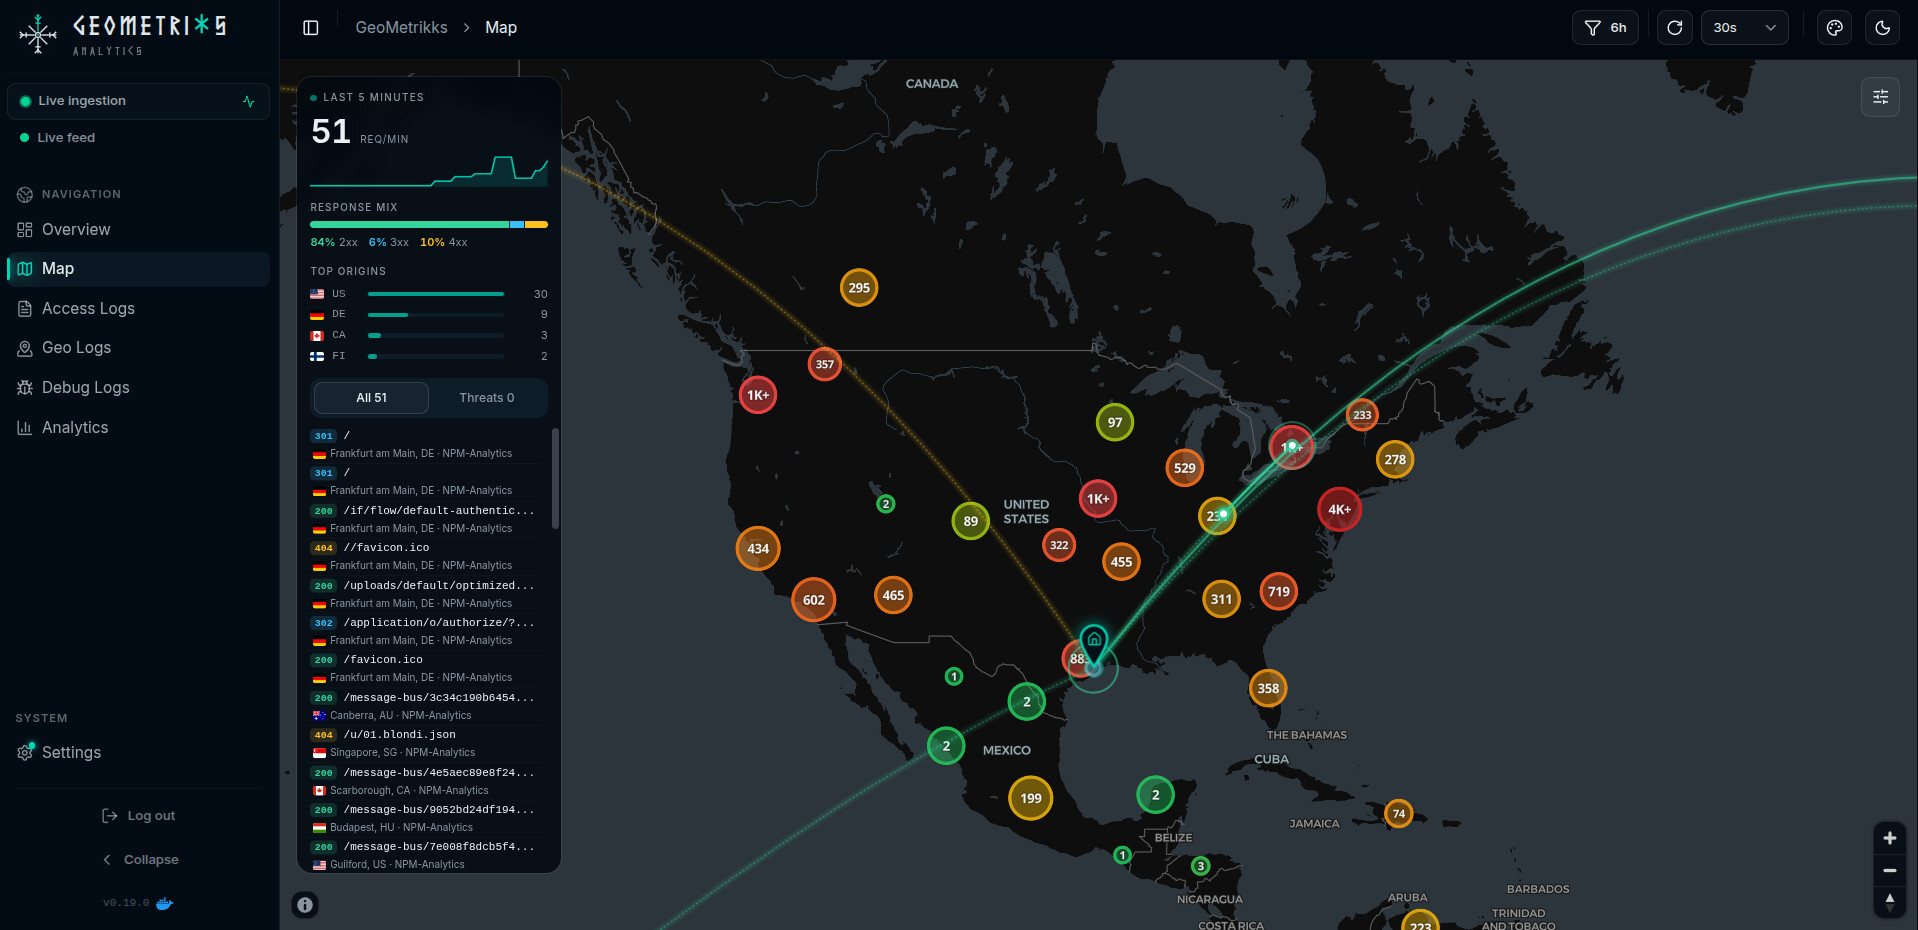
New traffic should generate traffic to a proxied website and look for new records once database downloads and ingestion startup are complete. Depending on the size of your logs and how many hosts you have you will see populated values. Head over to the map on the left margin.
 ![image](https://discussion.scottibyte.com/uploads/default/original/2X/3/32dd9179faef7d989d103232a773156362479b3b.jpeg)

Geometrilkks is a great way to monitor realtime access to your hosted services and display where they are coming from on a map.

---

<div class="post-metadata">

### Author: ![aldorr](https://discussion.scottibyte.com/letter_avatar_proxy/v4/letter/a/d9b06d/32.png) [@aldorr](https://discussion.scottibyte.com/u/aldorr)
#### Post date: [September 29, 2026, 10:52am UTC](https://discussion.scottibyte.com/t/nginx-proxy-manager-live-tracking/1547/2 "2026-09-29T10:52:39Z")

</div>

> [@scott](#):
>
> ```auto
> incus config device add NPM-Analytics npmlogs disk \
> source=/var/lib/incus/containers/NPM/rootfs/home/scott/NPM/data/logs \
> path=/home/scott/npmlogs \
> readonly=true
> 
> ```

Hi Scott,  
Thanks for the great tutorial.  
One thing I noticed, when I set up my NPM device a couple years ago, I used a ZFS volume, so the logs were in that location. I was able to locate them here:  
/var/lib/incus/storage-pools/default/custom/default\_NPM-Data/logs  
And then everything fell into place.  
Now I’m seeing the logs and live traffic.  
Take care!

---

<div class="post-metadata">

### Author: ![scott](https://discussion.scottibyte.com/letter_avatar_proxy/v4/letter/s/3e96dc/32.png) [@scott](https://discussion.scottibyte.com/u/scott)
#### Post date: [September 29, 2026, 5:50pm UTC](https://discussion.scottibyte.com/t/nginx-proxy-manager-live-tracking/1547/3 "2026-09-29T17:50:31Z")

</div>

Good point. The tutorial was based on folks that set their Incus servers up via my [Incus Containers Step by Step](https://discussion.scottibyte.com/t/incus-containers-step-by-step/349)tutorial and so yes, thanks for pointing out that if you did differently, you would need to adjust the target for the logs.
